Chapter 5 Case Studies
Case studies for roles at the major technology companies FANNG (or MANNG now), commonly have an applied section where you are to apply your product sense and knowledge of stats and ML to solve a problem related to the position you applied for.
The tips in this section were mostly complied via:
- Trustworthy Online Controlled Experiments
- DataInterviewPro
- How to Land a Product Manager Job in Technology.
5.1 Case Study Tips
Follow CAPER method when answering the case study questions:
- Clarify -
Some questions might include: * What is the business objective? * What is the data that is available? * Can you make the broad question more specific? 2. Assume
- State all of your assumptions.
- Plan
- Outline and break down your plan into tasks. Explain each step and ask the interviewer if they agree with the plan?
- Execute
- Walk through each step. Prepare the data, do feature engineering, code, and apply the relevant stats and/or modeling
- Review
- Repeat back the business objective, and explain what you did in your analysis. Reflect on what can be added or removed to improve the analysis.
5.2 Sample Questions
5.2.1 AB Testing Basics 1
What are some standard statistics that are used in AB Testing. What are the alternative tests and in what situations would you use them?
A/B testing is an experimental design, and in its simplest sense is an experiment on two variants to see which performs better based on a given metric. The null hypothesis would be that the effect of condition A is no different than the effect of condition B. Examples of a statistical test used in A/B designs are:
- Power analysis
- t-test (for difference in means, like sales)
- Alternative:
- Analysis of variance for three or more means.
- z-test for large sample size (>30 samples)
- Explaining the t-test - a t-test allows you to determine if average values of two data sets come from the same population (e.g. if sample from placebo and treatment you would expect different different mean and standard deviation)
- Assumptions
- scale of measurement applied to the data collected follows a continuous or ordinal scale, like scored on a IQ test.
- Sample is a simple random sample, representative. and randomly selected.
- data, when plotted shows a normal distribution.
- Homogeneity of variance. Happens when standard deviations of samples are approximately equal.
- Interpreting values:
- A large t-score indicates that the groups are different.
- A small t-score indicates that the groups are similar.
- Alternative:
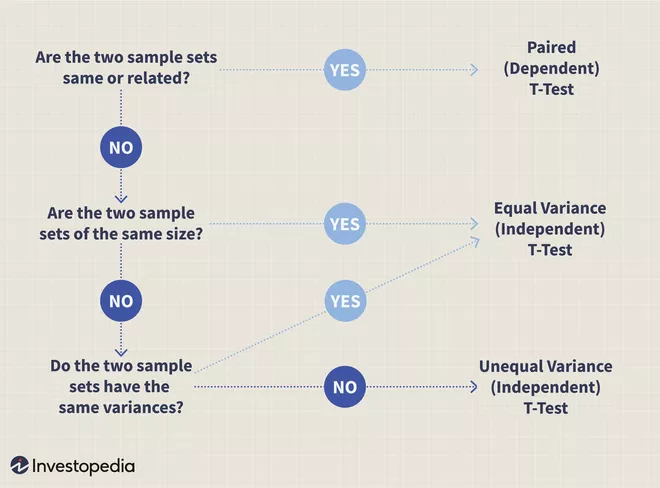
Figure 5.1: Which T-test to use
- chi-squared test (for differences in categories like conversions).
test of independence

- this test can tell us how likely it is that a random chance can explain any observed difference between actual frequencies in the data and theoretical expectations.
- When using A/B testing on boolean variables (click-through rate-click or no click, and conversion-convert or not convert) they follow the discrete probability distribution of Bernoulli Distribution.
Example: If showed two different advertisements, A and B to test clickthrough rate for an advertisement. We might have the following information:
Click No Click Click + No Click Ad A 360 140 500 Ad B 300 250 550 Ad A + Ad B 660 390 1050 - then need to make 4 calculations:
- Advertisement A, Click
- observed value = 360
- expected value = 500 * (660/1050) = 31.429
- Advertisement A, No Click
- Advertisement B, Click
- Advertisement B, No Click
- Advertisement A, Click
- 1 is done above but each other needs to be calculated and plugged into the formula for the chi squared test statistic.
- then need to make 4 calculations:
5.2.2 A/B testing new eCommerce recommendation engine
- A/B Testing
- Product
- Modeling
- Statistics
Suppose you’re working for an eCommerce company like Amazon. Your team is testing a new algorithm to generate recommended products for users. You’ve been tasked with setting up an A/B test to help measure the impact of the change, and decide whether or not to roll out the new recommendation engine more widely.
Walk through the steps you would take to set up the A/B test, and highlight some examples of potential pitfalls/risks in your analysis.
5.2.3 A/B testing a new landing page
- Python
- Product
- Data Structures
- Pandas
- Data Analysis
Suppose you are working for an e-commerce company and the marketing team is trying to decide if they should launch a new webpage. They ran an A/B test and need help analyzing the results. They provided you with this dataset, which contains the following fields:
- user_id: the user_id of the person visiting the website
- timestamp: the time in which the user visited the website
- group: treatment vs control, treatment saw the new landing page, control saw the old landing page
- landing_page: new vs old landing page, labeled ‘new_page’/‘old_page’
- converted: 0/1 flag denoted whether the user visiting the page ended up converting
Given this information, you’re asked to come up with a recommendation for the marketing team – should the marketing team adopt the new landing page? The team wants the landing page with the highest conversion rate.
5.2.4 Stopping an AB Test early
- AB Testing
- Statistics
What are some ways to stop a A/B test early when a fixed population and time have been determined before an A/B Test is implemented normally.
- Sequential experiment design - Sequential experiment design lets you set up checkpoints in advance where you will decide whether or not to continue the experiment, and it gives you the correct significance levels.
- Bayesian A/B Testing - With Bayesian experiment design you can stop your experiment at any time and make perfectly valid inferences. Given the real-time nature of web experiments, Bayesian design seems like the way forward.